Observing the results of diverse manipulations on the behavior displayed by the individuals represents an incredibly rich method. Experimental approaches to collect behavioral data are improving constantly to ensure that studies are rigorous and reproducible. That is why a lot of effort is invested in making methods largely specific for different species. Moreover, methods also need to accommodate the simultaneous analysis of multiple individual animals. The complexity of the data resulting from the highly specific behavioral analyses is something to be taken into account. Not to mention the difficulty to properly analyze all the data. For a perfect analysis, the conditions experienced by every individual in every experiment need to be completely comparable, so that any difference observed can be attributed to the modification introduced by the researchers. In this particular study, Xie and colleagues wanted to solve the issue of having slight differences in the conditions experienced during the visual motor response (VMR) test in Zebrafish. VMR test detects the motor response of Zebrafish larvae upon drastic light change (on or off). It can detect motor response thanks to the recording of the movements of the Zebrafish and the detection of the number of pixels that an individual moved in successive frames of the recording. Of course, a huge matrix containing the values of many larvae during large amounts of time is obtained, hence the problems for the analysis. Basic statistical methods are already insufficient, so more complex ones need to be applied. But Xie and colleagues detected a further problem. Some things vary from trial to trial or according to the exact location of the larvae in the test machine. So, how do we remove from our analysis the variation caused by these phenomena? This is why they proposed new methods of normalization (i.e. techniques to eliminate the variability induced by external factors). The main problems that could induce variation and that the team wanted to normalize were: a) different intensities of light received by the larvae according to their position in the test machine and b) replication of the study with intention of collapsing the data.
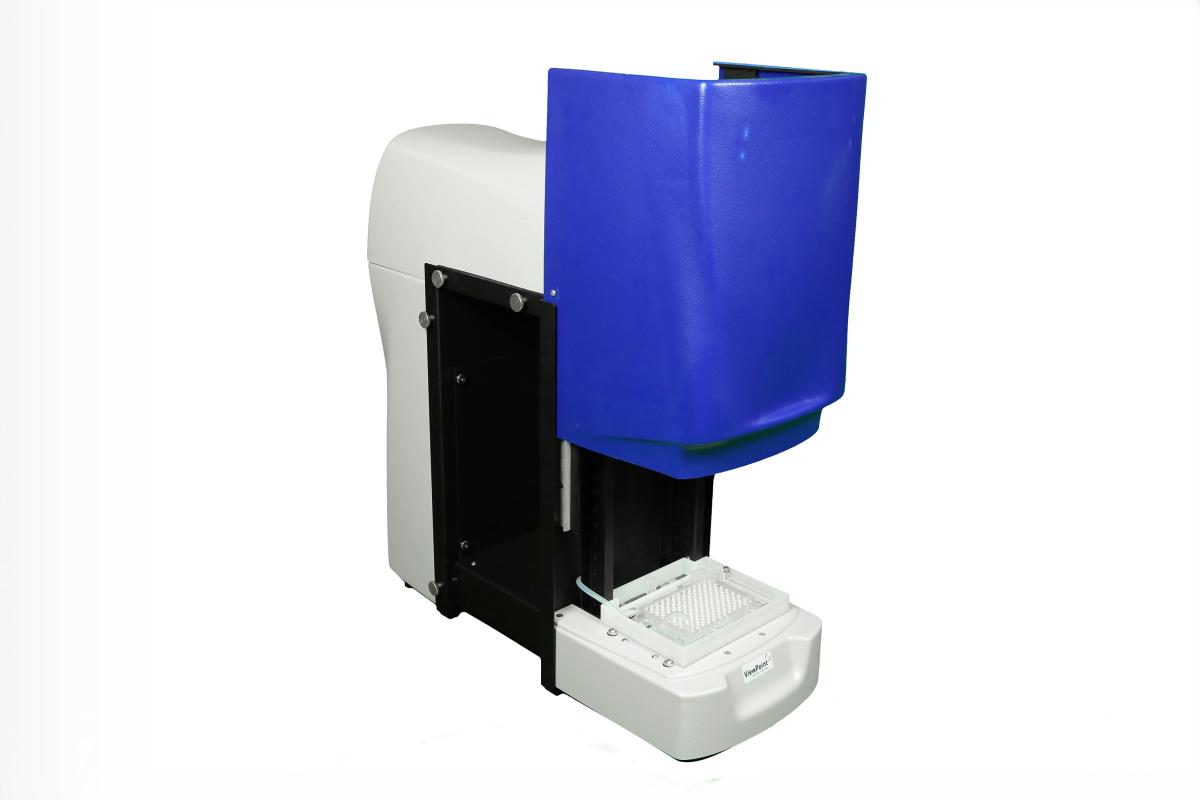
ZebraBox: the key to obtaining the data
To obtain all the data that they wanted to analyze, they performed the VMR test to the larvae daily from 3 days post-fertilization (dpf) to 9 dpf. They used a ZebraBox system to conduct all the experiments because the standardization that this system provides is very useful in reducing external variability. The larvae were each placed in a well of a 96-well plate. They received the light stimulus from a light-controlling unit under the plate. After the first 3.5 hours for dark-adaptation, three consecutive periods of light onset (Light-On) and light offset (Light-Off) followed, each lasting 30 minutes. All experiments were conducted at the same time of the day with the same type of 96-well plate to reduce variability. The ZebraBox system is perfect for this type of studies. It offers controlled experimental conditions and reliable results for up to 96 individuals at the same time (even more if multiple ZebraBox apparatus are used at once). ZebraBox provides long-term monitoring without compromising experimental conditions thanks to its integrated illumination, including infrared system, and water flow system.
Achieving normalization
Once all the data were obtained, the statistical procedure developed to normalize the data was applied. First, they achieved normalization of the light effect on individual wells. Then, they performed normalization of batch effect, which is one of the phenomena that happen when you want to analyze more individuals that you can test at the same time and you analyze them in different batches. Finally, they normalized the data of the different batches to a common baseline activity, because, on top of the variability of being analyzed in different batches, the activity of the individuals of these batches could differ before starting the experiment. After the integration of all the normalized data, the resulting data would be free from variations and could be used to find a true biological difference between samples.
The benefits of this procedure
An effective normalization should achieve two objectives: maintaining the real variability of the data and helping to find a clear grouping pattern for data to interpret the results appropriately. The model proposed by the team clearly fulfilled both objectives. To summarize, the team detected that available statistical analyses did not address an important issue encountered when analyzing behavioral data: the experiments are often subjected to external variations, which modify the data and obscure the results. To address this, they developed a normalization approach with many benefits: it is flexible (it can easily handle different types of variability), it allows for the integration of all the variability into one single model, it can be adapted to different sample groups, and it can normalize only a subset of data. The use of this new normalization method can be applied to other behavioral data with a similar structure, thus becoming an important tool for neurobehavior research.
References
Xie R, Zhang M, Venkatraman P, Zhang X, Zhang G, Carmer R, et al. (2019). Normalization of large-scale behavioural data collected from zebrafish. PLoS ONE. 14(2): e0212234.
Related products
VisioBox, ZebraTower, and ZebraLab.
Do not hesitate to contact us to know more about what we offer to upgrade your animal research!